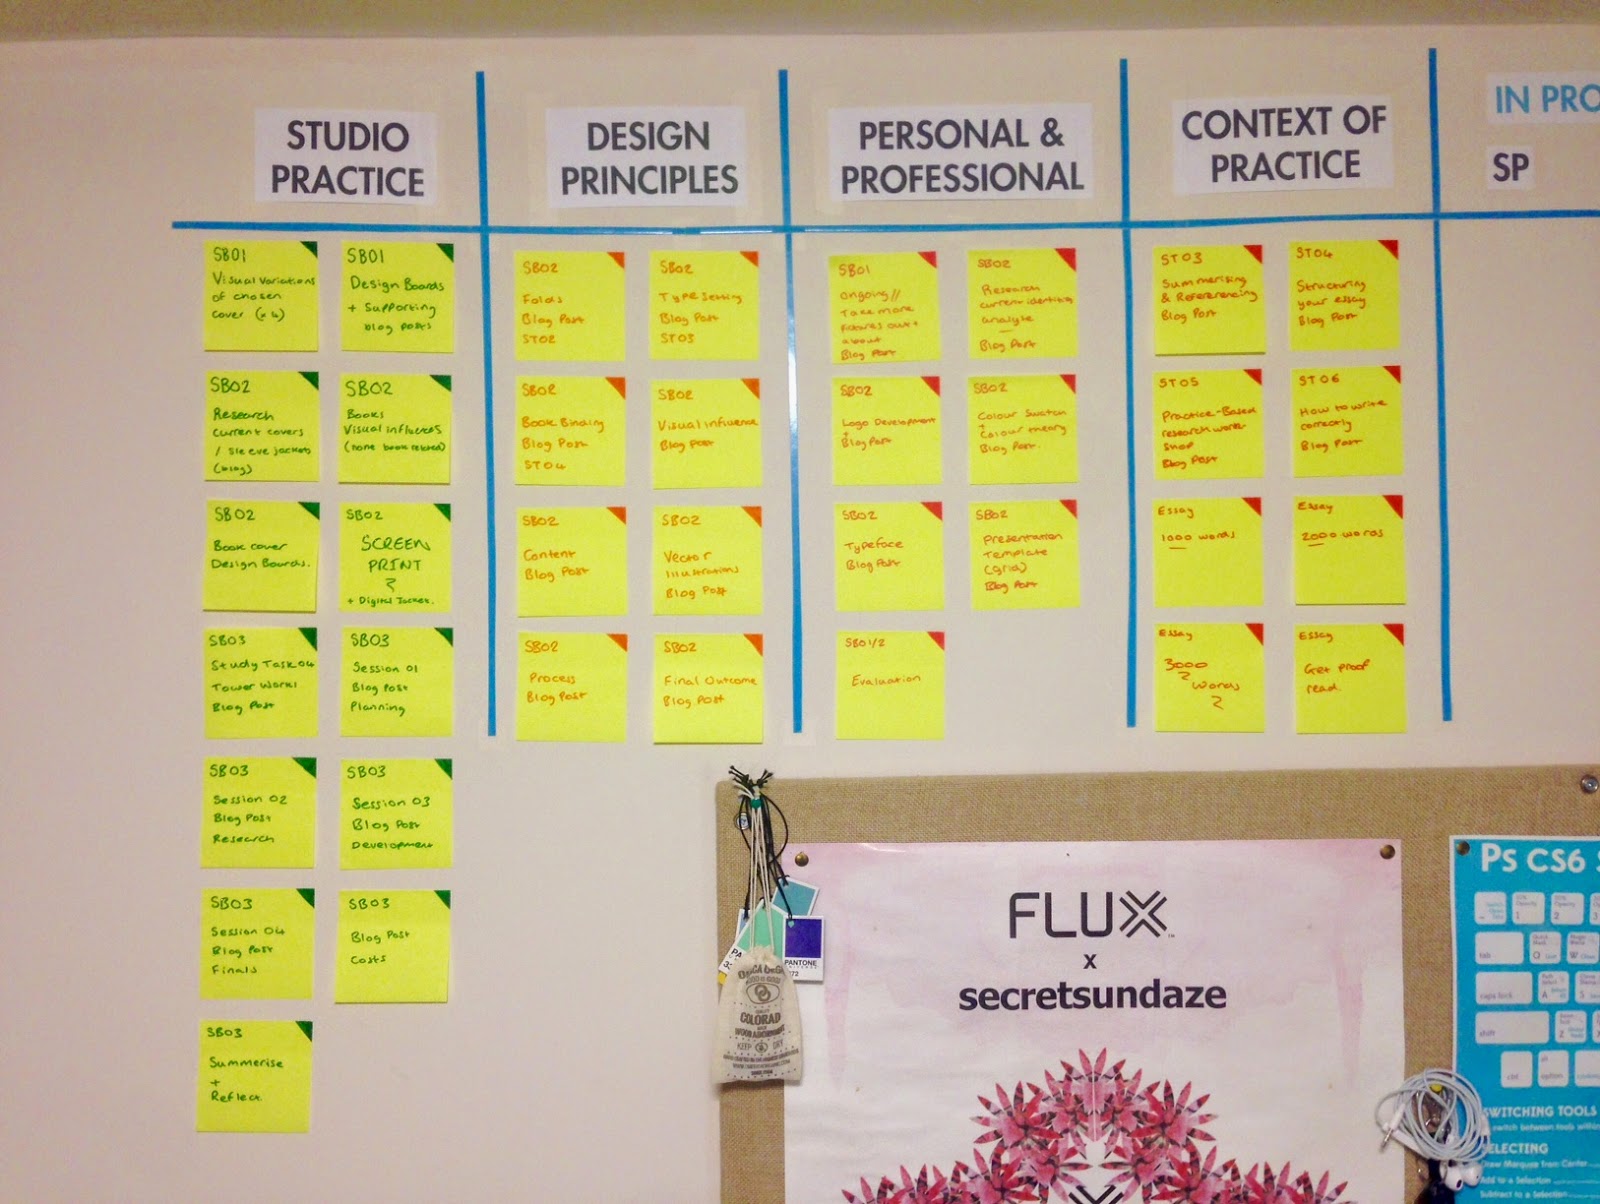
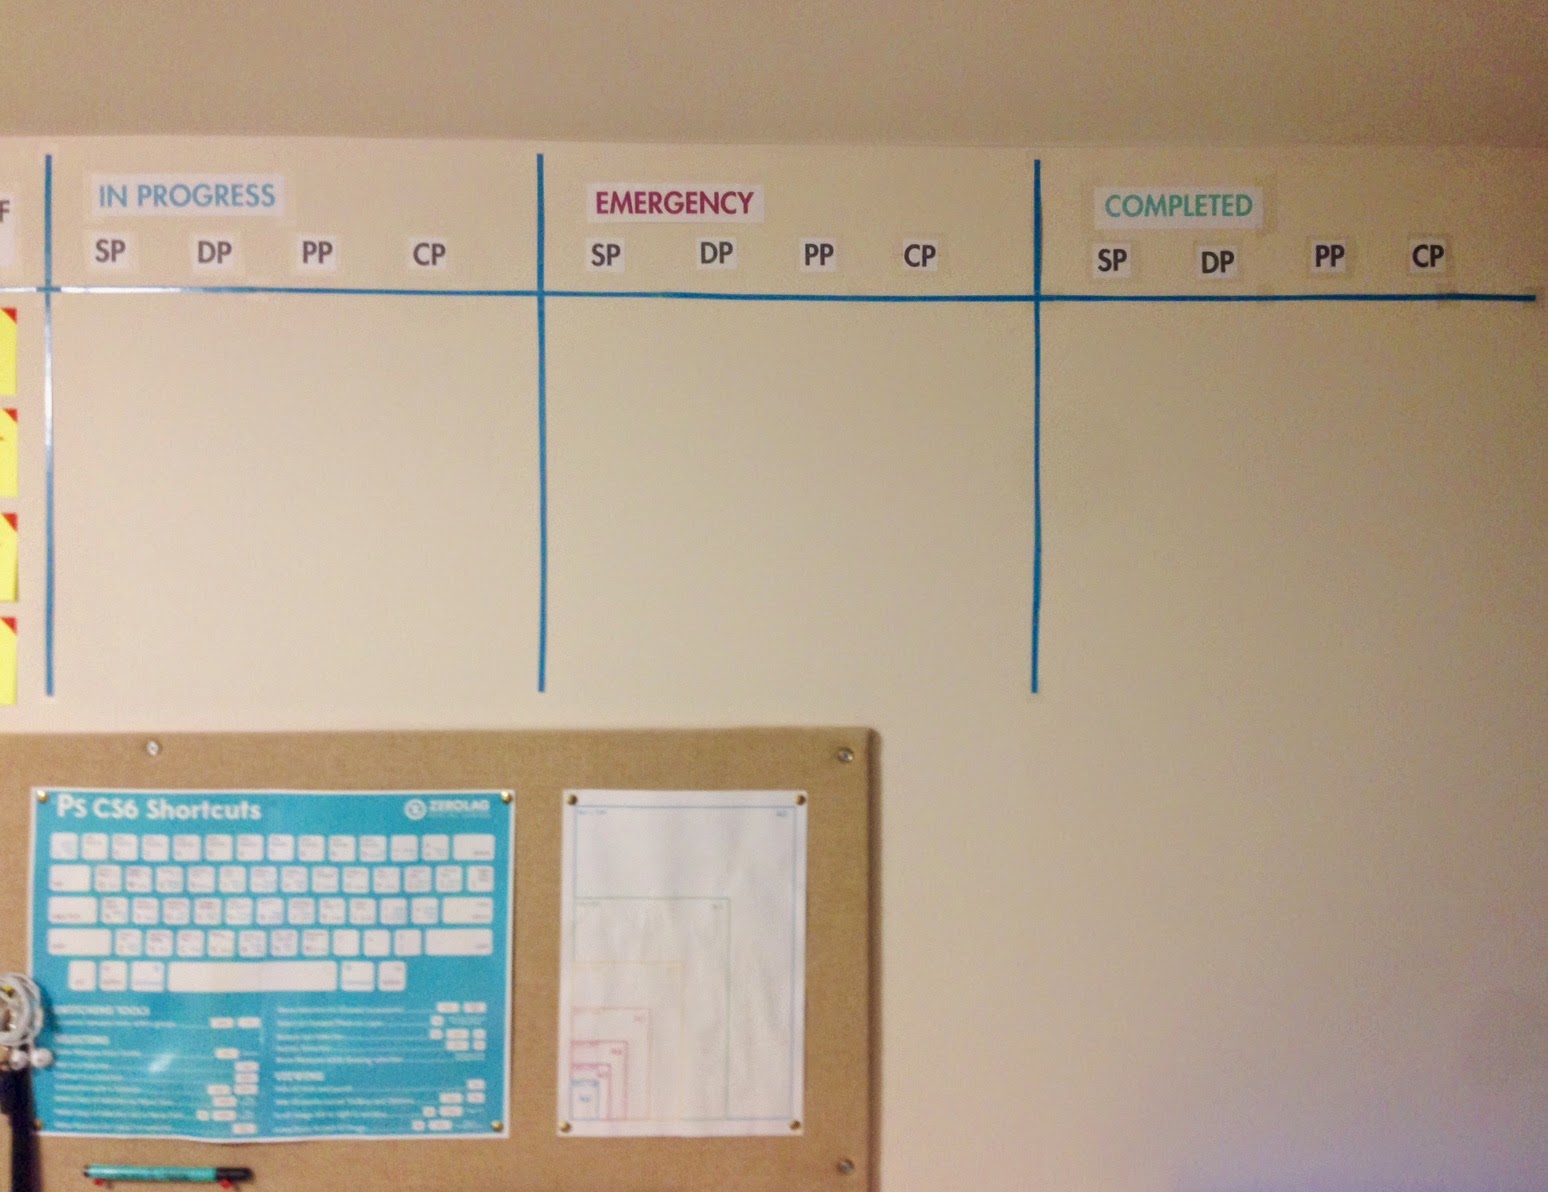
So I did a little more research into it, and I found the SCRUM chart. This is something more often used within software development to meet goals for a certain time frame. Something of which I found would be more useful to me, as I can visually interoperate how much I have to do and in what time I have left to accomplish it.
By using scotch magic tape curtesy of the course starter pack, I have devised a similar sort of strategy into my own line of work by using the same methodology to apply myself to complete tasks within a given time.


Being that this is an interactive form of tracking my time, I feel I will benefit more form this than any other method to time management.
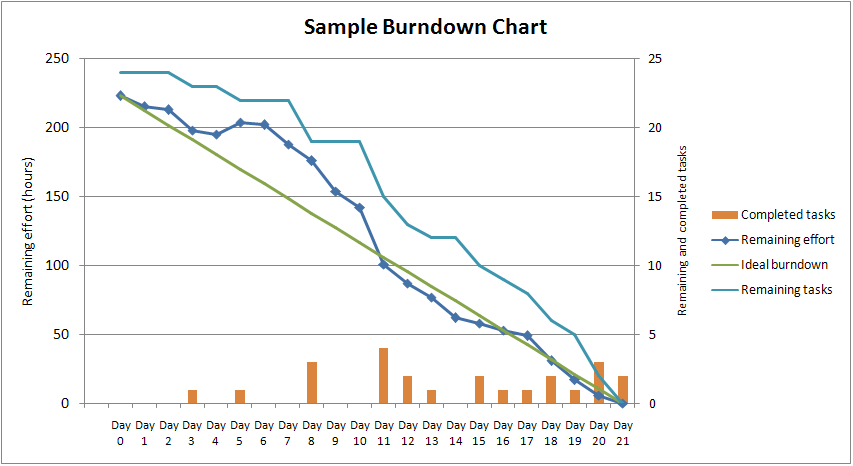
Later, a burn-down chart will be added along side the scrum task board, this gives me an idea of my progress within each aspect of the course and a line I can follow to ensure I am on track to complete all work within the given deadline.

An example of the kind of burn-down chart I will be using for each module of the course. (Source: Wikipedia)


No comments :
Post a Comment